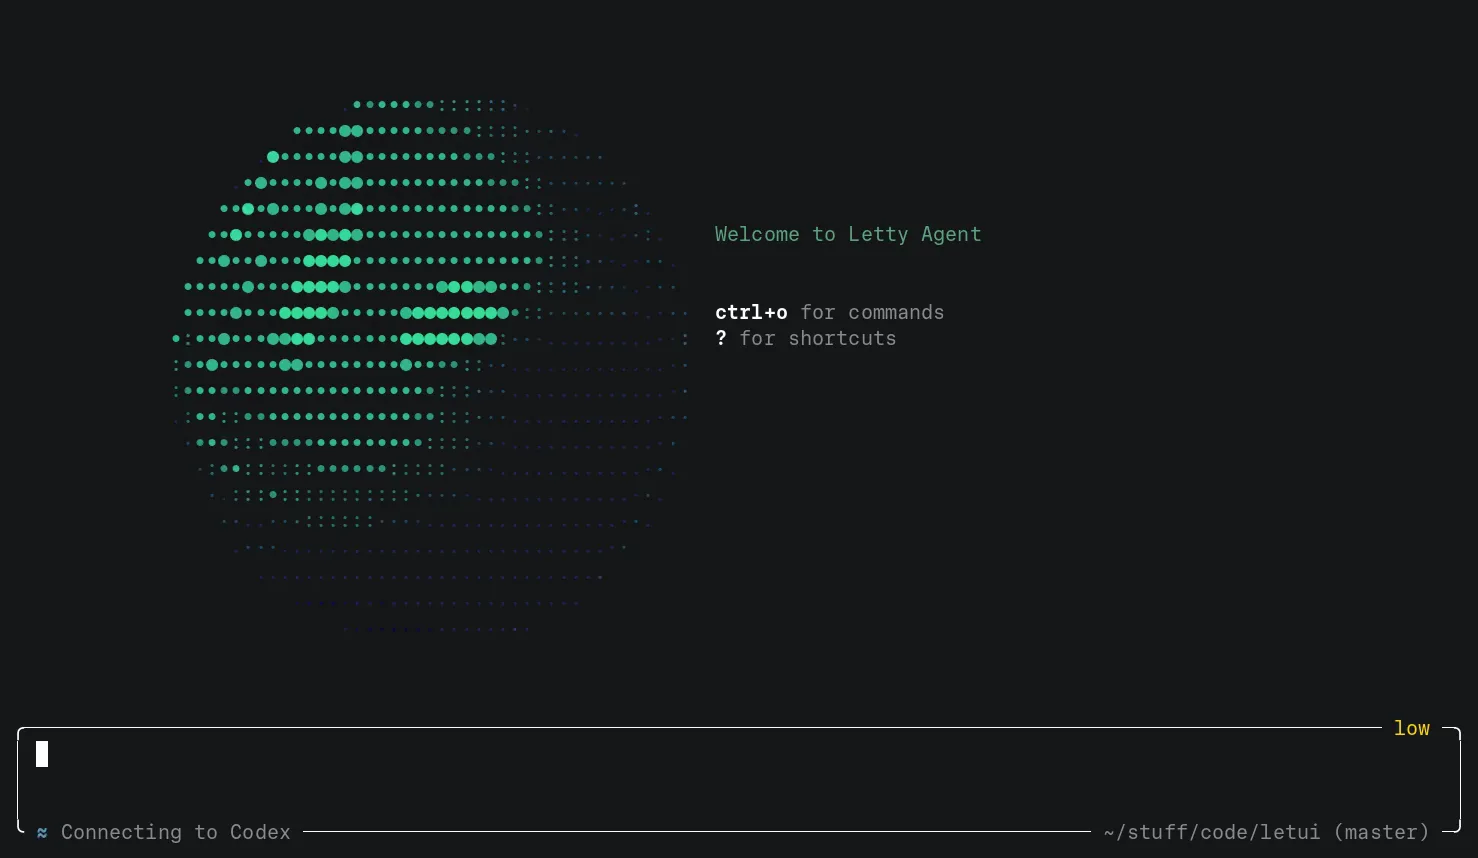
TUI library built from scratch with TypeScript and a Rust core, featuring a component-based API, signal-based state management, CSS-like styling API, a Rust-powered layout and rendering engine, and cell-based diffing.
In-browser MKV video streamer and player built from scratch, featuring real-time 4K anime upscaling powered by WGSL (WebGPU) shaders ported from Anime4K.
Paid music collaborations and song-cover campaigns for artists worldwide. Led frontend and backend development across both products, built the Next.js frontend from scratch, and owned payments, payouts, and mobile audio features. Cut data processing for 1M+ artists from nine days to seven hours and roughly halved Soundcharts costs.
AI mapping platform for satellite and aerial imagery. Built high-performance React interfaces for large imagery datasets, simplified component state and data flow, and helped move users to centralized sign-in with zero downtime.
Social content and analytics platform with shoppable feeds for brands. Led React adoption within an Angular application and improved embedded app performance for e-commerce sites across Europe. Built a custom state manager that cut the JavaScript bundle by 20% and automated package publishing.
hitidedec 2020 - feb 2021
Online clothing brand. Fully automated stock updates with a tested pipeline that transformed Airtable inventory data and stored it in the website's database.
Online sports insurance company for individuals, tournaments, etc. Built payment and subscription workflows and internal support tools, redesigned the PostgreSQL schema, and consolidated two backends into one codebase.
Optimization journey - I want 120+fps and sub 8ms frame times
[devlog] Building a TUI Library from Scratch: Part 3 - Optimization
Things I learned:
Measure first, optimize second
The less you do, the faster it runs
LeTUI was working. Signals drove reactivity, Rust handled layout via taffy, diff-based flush meant only changed cells got written to the terminal. Now I wanted maximum performance.
Time to actually measure things.
Building a metrics system
Before optimizing anything, I needed to know what was slow. I built a simple metrics tracker using Bun.nanoseconds():
typescript
export function startFrame(): number {
  return Bun.nanoseconds();
}

export function endFrame(startTime: number): void {
  const elapsed = (Bun.nanoseconds() - startTime) / 1_000_000; // ms
  frameCount++;
  frameTimes.push(elapsed);
  if (frameTimes.length > MAX_SAMPLES) {
    frameTimes.shift();
  }
}

export function formatMetrics(): string {
  const m = getMetrics();
  return `${m.fps}fps | ${m.avgFrameTime}ms avg (${m.minFrameTime}-${m.maxFrameTime}) | ${m.heapMB}MB heap | ${m.frameCount} frames`;
}
Now when I quit the app with Ctrl+Q, I get something like:
Target was < 8ms and I'm now averaging under 5ms. Occasional spikes to 13ms are likely JSON serialization for layout and rebuilding the taffy tree every frame.
What's next
Any signal change still triggers a full rebuild: node tree → JSON → taffy layout → full repaint. Obvious next steps:
Persist the node tree — call nodeFactory once, not every frame
Dirty tracking — only repaint sub-trees that actually changed
Binary layout protocol — replace JSON with packed buffers
But for now, results are pretty good. I really wanna stress test it and make a nice demo while doing it.
Part 4
Binary protocol, batched flush, and facing reality
Title was: Building a TUI Library from scratch: Part 4
Description was: Binary protocols, batched flushing, component API redesign, and facing competition
Originally posted Jan 8, 2026
Things I learned:
JSON serialization is secretly expensive — binary protocols are worth the effort
Batching writes is always faster than individual operations
Sometimes you need to step back and redesign the API before moving forward
After hitting ~5ms frame times in Part 3, I was feeling good. Then I looked at what was actually still slow.
Killing JSON serialization
Remember the "JSON serialization for layout" bottleneck from Part 3? Time to fix it. Every frame, I was doing this:
typescript
// Before - JSON serialization every frame
const tree = JSON.stringify({
  node: serializeNode(root),
  width: terminalWidth,
  height: terminalHeight
});
api.calculate_layout(ptr(Buffer.from(tree)), tree.length);
The fix: a binary protocol. Instead of JSON, I pack node data into a Float32Array and text into a Uint8Array. Each node gets exactly 7 fields (later expanded to 13):
On the Rust side, I replaced serde deserialization with direct pointer reads:
rust
fn parse_node(node_data: &[f32], node_offset: &mut usize, text_data: &[u8], text_offset: &mut usize) -> Node {
    let base = *node_offset;
    let node_type = NodeType::from_f32(node_data[base]);
    let gap = node_data[base + 1];
    // ... read remaining fields
    *node_offset += FIELDS_PER_NODE;
    // ...
}
This let me drop the serde dependency entirely. The real benefit was eliminating the allocation overhead of building and parsing JSON strings every frame.
Batched flush — the 3x speedup
The next big win came from terminal writes. My original flush() would set foreground color, set background color, then print a character — for every single cell that changed:
rust
// Before - command per cell
for each changed cell {
    queue!(stdout, MoveTo(x, y)).unwrap();
    queue!(stdout, SetForegroundColor(fg)).unwrap();
    queue!(stdout, SetBackgroundColor(bg)).unwrap();
    queue!(stdout, Print(char)).unwrap();
}
Fix: batch consecutive cells with the same colors into a single print:
rust
fn next_flush(w: u16, h: u16, stdout: &mut Stdout, buf: &[u64], last_buf: &[u64]) {
    let mut char_seq = String::with_capacity(w as usize);
    let mut batch_start_x = 0;

    for y in 0..h {
        for x in 0..w {
            // Skip unchanged cells
            if buf[idx] == last_buf[idx] { continue; }

            // Same colors? Keep batching
            if curr_fg == prev_fg && curr_bg == prev_bg {
                char_seq.push(curr_char);
                continue;
            }

            // Colors changed - flush the batch and start new one
            queue!(stdout, MoveTo(batch_start_x, y), Print(&char_seq)).unwrap();
            // ... update colors, reset batch
        }
    }
}
I also separated first-frame flush (writes everything) from subsequent flushes (only diffs). First frame streams left-to-right without cursor moves. Subsequent frames need MoveTo for each batch, but skip most cells entirely.
Result: 8-10ms flush → 3-5ms.
Adding phase timing
To see where time was actually going, I split metrics into phases:
typescript
export function startPhase() {
  return Bun.nanoseconds();
}

export function endLayout(startTime: number) {
  const elapsed = (Bun.nanoseconds() - startTime) / 1_000_000;
  metrics.layoutTimes.push(elapsed);
}

export function endPaint(startTime: number) {
  // ...
}
Paint was 81% of frame time. Good to know for later.
Component API overhaul
The library worked but the API was getting messy. Components had grown organically and the line between "what a component is" and "how it renders" was blurring. I split things into components.ts (pure definitions), runtime.ts (render loop, painting, events), and types.ts (interfaces).
Not real scrolling, but good enough for most cases. The frameWidth and frameHeight signals let components react to their actual rendered size.
Facing the competition
I finally benchmarked LeTUI against two other libraries: OpenTUI (Zig-based, used by OpenCode) and pi-mono (pure TypeScript, string-based rendering).
Equivalent demos, all three:
Library
Avg Frame Time
LeTUI
2.1ms
OpenTUI
0.4ms
pi-mono
0.2ms
Ouch.
pi-mono being faster was especially humbling — pure TypeScript with string concatenation, no fancy FFI or Rust. Turns out string building is really fast when you're not doing all the bookkeeping I was doing.
OpenTUI being 5x faster made sense — Zig, basically as close to the metal as you can get.
The path forward
At 2.1ms I'm well under 16.6ms (60fps) and even under 8.3ms (120fps). But clearly room to improve. Phase breakdown:
serialize: 0.1ms (5%)
layout: 0.1ms (5%)
paint: 1.7ms (81%)
flush: 0.2ms (9%)
Paint is the bottleneck. All those setCell() calls in JavaScript, writing to typed arrays — that's what's eating time. The obvious next step: move paint to Rust, same as I did with layout.
But for now, I have a working TUI library that can do 500+ fps on a good day. Time to actually build something with it.